To intervene at any socio-economic development endeavors availability of realistic, current and consistent demographic data pertinent to the zone is very crucial. Hence, among various demographic variables, information on population size and distribution are very crucial for planning, monitoring and evaluation of any development programs. Since population has direct relationship with development efforts, planning and implementation of any development programs requires the actual size of population and distribution size and other major population dynamics.
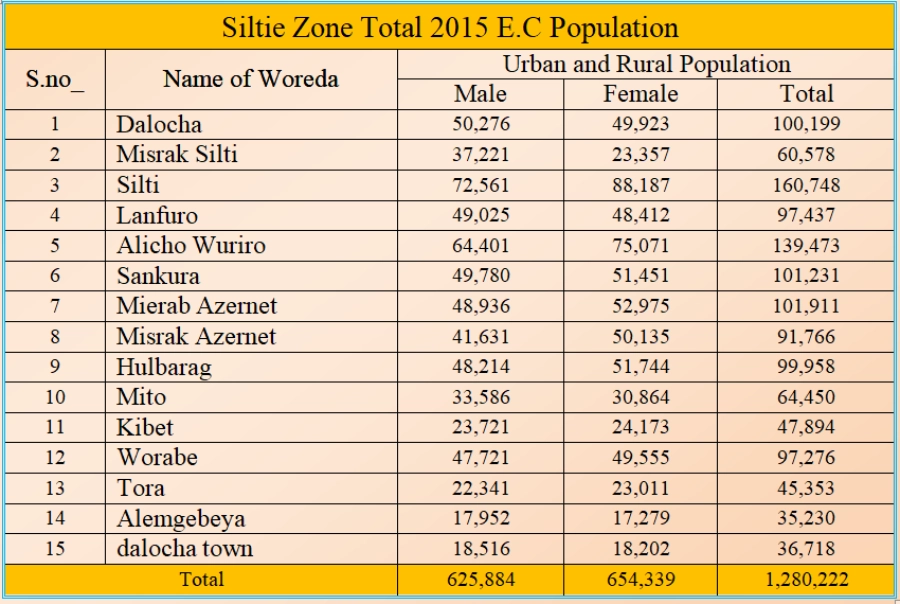
According to 1999 E.C National population and Housing census result the total population size of Selite zone population was 1,280,222 which 625,884 were Males& 654,339 were females in 2015 E.C.
Based on this with an average annual growth rate of 3.24%, of the zone`s. This indicates that the percentage share of females is relatively high. In addition to this about 77.63 % of the population resides in rural areas and only 22.37% in urban.
Source Based on 1999 CSA Population Projection.
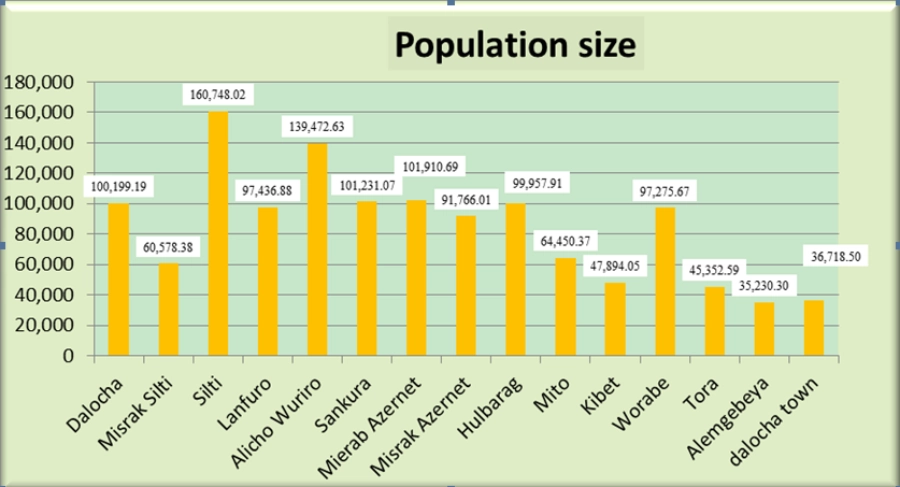
The graph indicates, Silti, Alicho Wuriro, Mierab Azernet and sankura are woredas in which the largest population reside and totally accounted for 35.5% of the total population. Dalocha and Alemgebeya town administrations have the lowest population lives.
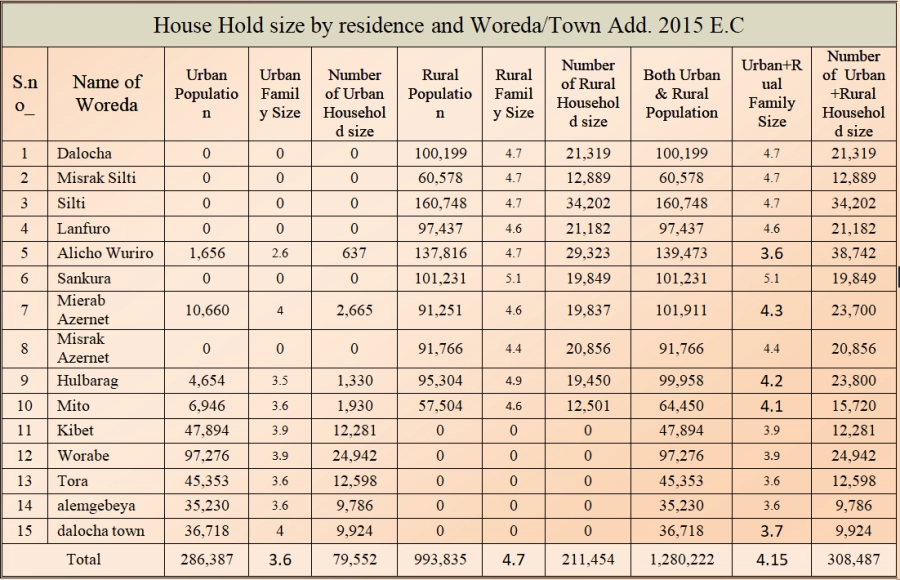
A group of Person living together in the same housing unit and have a common cooking and eating arrangement is referred as household. According to 1999 E.C. (2007) Census results, there were 164,076 households and an average household size of 4.6 in the zone. In 2015 (E.C.) the adjusted household size was 308,487 revealing the average household size (family size) of 4.15 in the zone. The average number of family size varies significantly from one woreda to another. For instance, the highest average family size was observed in Sankura,Silti, Misrak Silti, Lanfuro, & Misrak Azernet Berbere (5.1,4.7, 4.7, 4.6 and 4.4) In 2015 E.C.
An Ethnic group is a group of persons bound together by a common language, norms, beliefs, identity, and geographical surroundings. In Seltie zone, there is one ethnic groups living in various part of the zone. The SNNP‘s Nations Nationalities Institute of study is responsible conducting research region`s nationalities, culture Language and history. According to the Institute, The ethnic groups are classified in to the major language family called Cushitic, Omotic, Ni1o-Saharans and Semitic. These major Ethnic groups are residing in their own administrative geographical area/zones, special woredas or woredas having unique language, culture and other social values. Seltie peoples are grouping in the Semetic Ethnic groups.
Population density can be defined as the average number of people that inhabited per square kilometer. The total size of the zone population in 2015 E.C is estimated to be 1,280,222 while the total area of the zone 2700.04 Km2. Hence in 2015 E.C. by considering the land mass of the zone, the crude Population density of the zone was 474 persons per square kilometers. There is a remarkable variation in Population density from one woreda to another.
Siltie zone people age structure based on population projection. According to the Projected Population of CSA, in 2015 about 47.73% of the Population is under age 15 and the elderly (65+) accounts for 3.03 percent.
The remaining belongs to working age population (aged 15-64) accounts for about 49.24 Percent of the total zonal population.
The Population Pyramid of zone has broad base that implies a very large Proportion of Population that belongs to younger age groups. The pyramid is the result of very high fertility since new births are naturally added to the bottom producing a broad based age and sex distribution.
Age dependency indicates the number of economically inactive (non-productive) people of a given Woreda, zone or region. The age group fewer than 15 and above 65 are considered to be unproductive. While the people from age 15 to 64 are economically productive which enter in the labor force (Table 3.7).You can calculate the ratio by adding together the percentage of children (aged under 15 years), and the older population (aged 65+), dividing that percentage by the working-age population (aged 15-64 years), multiplying that percentage by 100. So, the ratio is expressed as the number of ‘dependents’ per 100 people aged 15-64 years.
The higher the dependency ratio, the more people who are not of working age, and fewer who are in the labor force (and paying taxes based on the 2016 E.C. age group population size of the zone, the calculated dependency ratio for the zone is 103.09 which means 103.09 inactive persons depend on every 100 economically active /productive/ people. Mito Woreda and Misrak Silti Woreda have highest Dependency ratio for every 100 economical productive persons there are 103.73% and 105.60% dependent populations respectively. While in Silti and Misrak Azernet Berbere woredas the dependency ratio pressures is comparatively low and fall within the range of 102.35% & 102.39% respectively dependent populations for every 100 productive people.
For more and to get detailed information about Silte zone population size and distribution please download the file below!
Silte_Silte zone data.pdfDownload our app 👇